Philanthropy is built into the structure of many of the world’s biggest and most successful corporations. In fact, some argue that it is because of these corporate philanthropic endeavors that they are successful.
To measure that success, Moonridge Group, headed by founder Julie Murray, in partnership with Jeremy Aguero, Applied Analysis, and the Nevada Corporate Giving Council surveyed Nevada businesses as to their philanthropic efforts.
The survey asked questions to determine the amount of funds and time donated to charities, along with the types of charities and causes during the calendar year 2015 or the fiscal year that ended June 30, 2016. The questions also included the amount of time donated by employees; how engaged the employees are toward the company’s philanthropic commitments; and the expected returns on those charity investments.
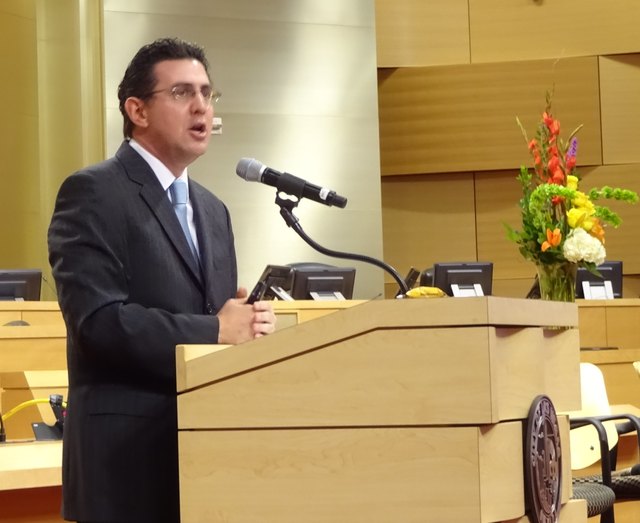
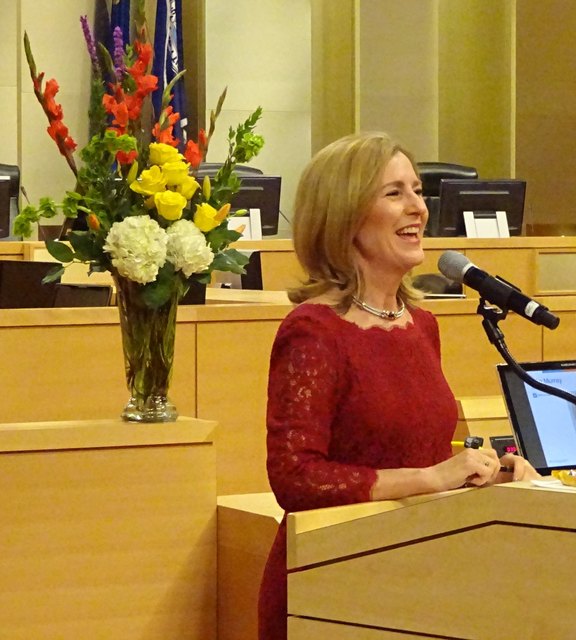
The results of that survey were presented to an audience of nearly 250 funders Feb. 10 during Las Vegas-based Moonridge Group’s annual Philanthropy Leaders Summit at Las Vegas City Hall.
The big news is that corporations in Nevada, representing more than 120,000 employees and generating nearly $40 billion in business receipts, gave back an estimated $132.5 million to charity. That equals 0.38 percent of their total revenue and is nearly three times more generous than the 0.13 percent of revenue given nationally.
The state’s workforce recorded more than 482,000 volunteer hours credited to company volunteer programs. Nearly 79 percent of the companies surveyed offer a company-sponsored volunteer program. Of those companies, 56 percent offered four or more days, 33 percent offered two or three days, and 11 percent offered one volunteer day.
Approximately 79 percent of the companies surveyed had some sort of employee gift-matching program or combination of programs, such as a workplace giving campaign, 44 percent; a dollars for doers program, 44 percent; and a year-round matching policy, 33 percent; and 44 percent had some other form of gift-matching program available to employees.
The charitable-giving decisions don’t always originate at the top of the organizational chart. Only 21 percent reported their decisions were made by the CEO, chief financial officer or chief operating officer, and another 7 percent said the board of directors made the decisions. The largest number, 29 percent, reported that a separate corporate philanthropy leader in the organization made the decisions, and another 21 percent have a separate company foundation leadership. The remaining companies hand the decision over to the employees, 15 percent, or a charitable giving committee, 7 percent.
The companies surveyed were asked how they made their decisions as to what charities they would support. They did this by ranking their decision-making factors from 1 (least important) to 10 (most important).
▶ Strategic giving (giving that aids business goals and serves critical community needs), 4.6
▶ Community relationships with longtime recipients, 4.5
▶ Assessment of the greatest needs in the community, 4.2
▶ Demonstrated results by potential applicants, 3.9
▶ Quality of applications/requests from potential recipients, 3.6
▶ Personal convictions of company executives, 3.5
▶ Commercial opportunities (giving that furthers corporate image or company goals), 3.3
▶ Pre-defined company giving focus area, 3.2
▶ Reactive giving (e.g. disaster relief), 2.9
▶ Frequency of applications/requests from potential recipients, 1.8
While companies largely agreed on the important factors in their decision-making processes, their motivations for doing so differed widely. When companies were asked to rank their motivations for giving (on a scale of 1 lowest, to 4 highest), every possible answer was chosen as the most important at least once.
▶ Community wellness/sustainability where the companies’ employees live and work, 4.2
▶ Protecting/enhancing the company’s reputation, 3.9
▶ Providing opportunities to engage with the company’s employees, 3.6
▶ Creating opportunities for business innovation or growth, 3.0
▶ Increasing customer loyalty, 2.9
At the top of the list is education, receiving a total of 37.4 percent, broken down between higher education (24.8 percent) and K-12 (12.6 percent). Nationally, K-12 receives 16 percent, and higher education receives a more modest 13 percent.
Next on the list, and moving up in the rankings, is the arts and culture category, garnering 13.4 percent compared to last year’s number — and the current national average — of 6 percent.
Overall, Nevada’s arts and culture industries account for an estimated 5,643 employees. According to the report, that number is deceiving due to the high number of employees involved in the large-scale production shows at the Las Vegas resorts. Industries such as motion picture production, museums and even theater companies are relatively lacking in Nevada, and a focus on improving our area’s cultural amenities is needed to better maintain a connectedness with its residents.
Rounding out the list is health and social services at 12.5 percent; environment, 10.1 percent; civic and public affairs, 8.9 percent; community infrastructure, 7.8 percent; and other and unknown at 9.8 percent.
According to Moonridge Group, total philanthropic giving is expected to increase by 3.8 percent in 2017 with foundation and corporate giving making up 20.6 percent of the total giving pie. The projected three major benefactors are health and wellness (up 8.5 percent), education (up 6.3 percent) and public society benefit (up 5.2 percent).
A full report on Corporate Philanthropy in Nevada is available through the Moonridge Group Philanthropy Advisors at moonridgegroup.com.


