The Las Vegas Valley’s multi-tenant, speculative office market saw 47,000 square feet of new space completed during Q3, 2015, raising total inventory to 43.1 million square feet. The vacancy rate was 21.3 percent at the end of Q3, down slightly from 21.6 percent in Q3, 2014. The 200,200 square feet of net absorption in Q3 marked positive demand for eight out of nine quarters.
At the end of the quarter, there were 218,000 square feet of spec office space under construction and 419,600 square feet of space in the planning stages. Most of the space under construction is due to the Union Village project in the Henderson submarket.
Office-related jobs
Employment in the office-using sector comprised 31 percent (257,200 jobs) of all private payroll jobs in Clark County in October 2015. This was 10,700 more (+4.3 percent) than existed in October 2014.
Office-using job growth in 2015 was weaker than in 2014, with 2.6 percent average monthly growth this year compared to 3.9 percent last year. The professional and business sector grew by 7,600 jobs (6.4 percent) while the health care and social assistance sector grew by 4,400 jobs (6.0 percent). The Information sector grew by 600 jobs (+5.8 percent) while financial activities was the only sector to lose jobs (-1,900 jobs, -4.3 percent).
Of these sectors, some have recovered all the jobs lost due to the recession, while other sectors are still recovering. Health care and social assistance was the one sector unaffected by the recession; it never lost any jobs. Business and professional services has recovered 129 percent of the jobs lost during the recession. Information jobs are at 69 percent of their peaks levels while financial activities jobs are at just 24 percent of peak levels. Both sectors are continuing to shed jobs.
Vacancy and rents
Total spec office vacancy in the Valley in Q3 (directly vacant space plus vacant sublease space) decreased to 21.3 percent. This matches the most recent Q4, 2014 vacancy low and continues the trend of improvement in the market. The valley-wide spec office vacancy rate is also 0.3 percentage points lower, year-over-year.
The data suggest that the overall market is slowly recovering but still continues to struggle, despite healthy office-using job growth. Simply put, way too much office space was built during the boom years. It will take several years of natural population and job growth to move the spec office vacancy rate back toward its natural 10 percent equilibrium level.
The overall average monthly spec office rent (calculated on a full-service gross basis—or accounting for all operating expenses) was $1.91 per square foot in Q3, $0.03 more than the $1.88 per square foot asking rent in Q3, 2014. (Note: Rents herein are based on quoted asking rents, not negotiated rents between owners and tenants.)
Demand and supply
Valleywide spec office net absorption in Q3 was encouraging at 353,800 square feet, on a year-over-year basis. This is much less than the 1.6 million square feet recorded in the same period in 2014, but growth nevertheless. Year over year absorption has now been trending down for four quarters, after peaking in Q3, 2014. However, there is reason to believe that this is at least partially due to the quality of the remaining available space.
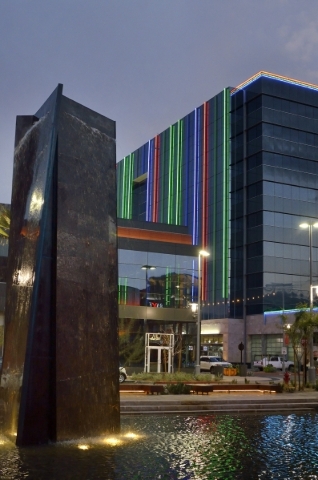
As of the third quarter, the spec office market saw three completions for 259,900 square feet in 2015. The “big one” was Downtown Summerlin (Class A-197,100 square feet). This was likely the most high-profile completion since Phase 1 of Tivoli Village opened in 2011.
In addition to Downtown Summerlin and the Gramercy (Class A-170,000 square feet) in 2014, two big spec office completions are scheduled for completion in 2016: Phase 2 of Tivoli (Class A-68,000 square feet) and Union Village (Medical-150,000 square feet).
A new large project, The Grid (Class A-125,000 square feet), is set for a 2017 opening in downtown.
The acceleration in high profile construction is a welcome sign for the spec office market. Despite the relatively high vacancy rate, these projects indicate that the market is improving fast enough to warrant new space if the space has the right qualities, which at present appears to be larger Class A spaces.
Thoughts and recap
While Southern Nevada’s office market recovery has lagged behind that of the industrial and retail markets, 2015 saw some moderate improvements. Valley-wide spec office net year over year absorption in Q3 totaled 353,800 square feet, much less than the 1.6 million square feet recorded in the same period in 2014. Year over year absorption has now been trending downward for four quarters, after peaking in Q3, 2014. As noted above, there is reason to believe that this is at least partially due to the quality of the remaining available space.
Employment in the office-using sector, a critical indicator of the health of the local economy, comprised 31 percent (257,200 jobs) of all private payroll jobs in Clark County at the end of October 2015. This was 10,700 more (+4.3 percent) than existed in October 2014.
Total spec office vacancy in the Valley in Q3 (directly vacant space plus vacant sublease space) decreased 0.3 points to 21.3 percent. This matches the most recent Q4, 2014 vacancy low that occurred previous to the increase in vacancies in Q1 and continues the trend of improvement in the market.
Completions as a share of inventory peaked at 4 percent in Q1, 2007, at the peak of Southern Nevada’s “age of irrational exuberance.” Q3 ended at about 0.1 percent.
In summary, Southern Nevada’s spec office market continues its steady albeit long recovery. Some submarkets and some office products are doing better than others. The office-using job market is greatly improved, but annual economic growth is still less than half that was seen during the pre-recession period.
full-service gross


