The Las Vegas Valley’s long-troubled market for office space is staging a small comeback.
A bit more than 169,000 square feet in total were absorbed during the first quarter. Total vacancy rates have dropped to 18.4 percent, down from 18.8 percent in the previous quarter. Direct absorption for first quarter is reported at just over 159,000 square feet while direct vacancy is 17.5 percent.
Within Southern Nevada, which is broken down into sections, there are 1,991 commercial office buildings containing 43,662,011 square feet, categorized as Class A, B or C space. More than 8 million square feet of that space remains vacant.
According to Xceligent, a firm that tracks all commercial real estate sales and leases, the tenants accounting for the majority of the lease expansions signed during the first quarter were mortgage companies, law firms and service companies.
United Health Care, which gave up 43,580 square feet of space in the northwest, consolidated its operations into 100,625 square feet in the Central West. JSA Healthcare also acquired 38,624 square feet, accounting for two of the largest square footage acquisitions.
Companies such as B.O.N. Labs, Component Assembly Systems, Spectrun Services and InCorp Services gave up a little more than 54,330 square feet in the past quarter.
Tenants in the Southern Nevada market are agreeing to longer-term leases due to the lack of new speculative development in the office sector. According to Xceligent, the high cost of land prices along with high construction costs are the cause of low speculative development.
Robert “Bob” Potter of Affordable Concepts, a local commercial contractor agrees. “The cost of building materials such as asphalt, concrete, steel, etc., is going up by 3 to 7 percent each month. Also, because of the labor loss during the recession, there is now a shortage of experienced construction workers. It used to be that a contractor would write off the labor, but now they are building it into the price,” said Potter.
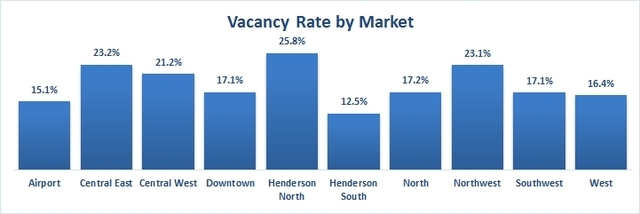
The area with the highest vacancy rate is Henderson North at 25.8 percent and the lowest is Henderson South at 12.5 percent. Those figures are even more impressive considering that Henderson South has a total of 4,418,508 square feet of total inventory and Henderson North has only 1,793,861 square feet of total space to fill.
The West section of the valley has the highest inventory of developed property at 7,682,189 square feet, divided among 331 buildings, and the third lowest vacancy rate at 16.4 percent.
The Airport section has the third-highest amount of developed property at 5,581,477 square feet divided among 238 properties. It has the second-lowest in vacancy rate at 15.1 percent.
To prove how numbers can be deceiving, the north part of the valley, which ranks No. 6 in vacancy at 17.2 percent, falls into last place for the amount of developed commercial properties at 1,218,475 square feet, divided among 89 buildings.
The average weighted asking rates range from $1.34 up to $2.23 per square foot.
It is no surprise that the highest rates are in areas with the least percentage of available Class A and B office space.
Downtown Las Vegas has the highest demand for office space and one of the lowest vacancy rates but ranks No. 8 (out of 10 markets) for the total available office square footage. Because of the supply vs. demand factor, Downtown Las Vegas garners the top lease rate of $2.33 per square foot, followed by the Southwest at $2.04, and the West at $2.02.
Though the number is low, there is 231,555 square feet of new construction being built in the West, Southwest, North and Airport areas of the valley. How the new space affects the occupancy rates will play out in the coming quarters.
Not every building in the Las Vegas Valley is included in this report. The Las Vegas office tracked set consists of all existing single and multitenant office buildings larger than 5,000 square feet, excluding government buildings, medical buildings and office condo buildings.
Also, the average weighted asking rates are expressed as a full-service/gross rental rate and weighted on total direct available square feet. Nonfull-service rates (such as NNN) have been grossed up to reflect a full-service/gross rate.