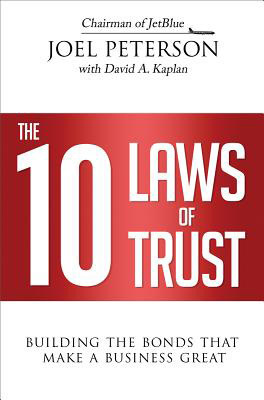
“The 10 Laws of Trust: Building the Binds that Make a Business Great” by Joel Peterson (AMACOM, $15.95).
Peterson’s 35-plus years in the business world span entrepreneurial ventures, commercial real estate, academia, venture capital and dozens of private and public boards of directors. He’s seen what trust builds and what a lack of trust destroys.
His 10 laws are the foundation of business-building; I found the basis for implementing the last six in the first four:
1. “Start with personal integrity.” There aren’t personal and work life compartments for trust, character and values. Regardless of where you are, you are who you are. People see through facades; once they do, they won’t follow.
Integrity also involves competence. Getting the right things done right and on time reinforces trust because it demonstrates follow-through commitment.
2. “Invest in Respect.” Spreading trust throughout an organization “depends more on the value placed on individuals than on management techniques or policies.” The keys: A. Obtain feedback and listen without judging (‘Yes, and…,’ not ‘Yes, but…’). B. Connect to people on a personal level (e.g. remember names, interests, contributions, their projects, etc.).
When people respect each other, collaboration and teamwork prosper because there are fewer silos, trash-talking, politics and personal agendas.
3. “Empower others.” High-performance environments allow employees to figure out ‘how’. They have leeway to question and create. On occasion, they might “drive into the ditch”; that doesn’t mean you should take away their keys.
Consider letting employees set their performance measures and objectives because it gives them a real sense of ownership and control. I did this in my corporate days and found that my staff always set and achieved goals higher than those I would have given them.
4. “Measure what you want to achieve.” Expectations must clearly define the ‘what and when’. When empowered people, know what success looks like, they accept responsibility and accountability for making things happen. Trust prospers when individuals are given the credit they’re due; it wilts when leaders hog the spotlight.
Key takeaway: Trust drives continuous improvement and execution.
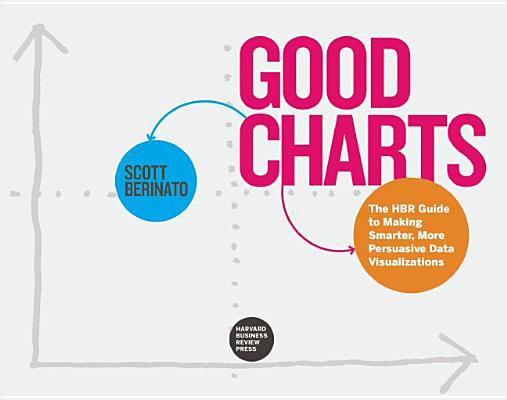
“Good Charts – The HBR Guide to Making Smarter, More Persuasive Data Visualizations” by Scott Berinato (Harvard Business Review Press, $35).
Data visualization (dataviz) started when cavemen drew lines in the dirt to show others where they could find food and shelter. During the Industrial Revolution, management used charts and graphs to reduce complex narratives. Today, it seems dataviz has gone overboard as too many audiences miss the point and suffer ‘death by PowerPoint’.
Berinato takes dataviz back to basics by providing information about how we see. Eyes don’t read charts like they read a narrative, which strings together sentences in order. With charts, the eyes are automatically attracted to focal points, peaks and valleys and colors before they even look at the title. The eyes go to the chart’s title to confirm its message.
With this in mind, keep it simple; show a “single salient point so clearly that we feel we understand the chart’s meaning without even trying.” Two bars or two lines do this effectively.
But every situation isn’t described so easily because relationships frequently have many variables. The more variables depicted, the greater the difficulty in determining meaning. How many is too many? Berinato advises five to 10, but much depends on the audience, too. People familiar with the topic will see more than those who aren’t.
Care must also be taken with the creation of the X (horizontal) and Y (vertical) axes and the legend. Relative to the axes, lengthening or shortening either can literally create an optical illusion that distorts visualization.
Having numerous color-coded legend items creates problems because people have difficulty determining shades.
With these factors in mind, Berinato shows hundreds of visual examples that help chart creators focus on the information they need to include and how to effectively present it.
Jim Pawlak is a nationally syndicated reviewer of business books.

